Placing one foot in front of the other even when you get knocked down eventually gets you to where you want to go.
By Jeneane Benedict
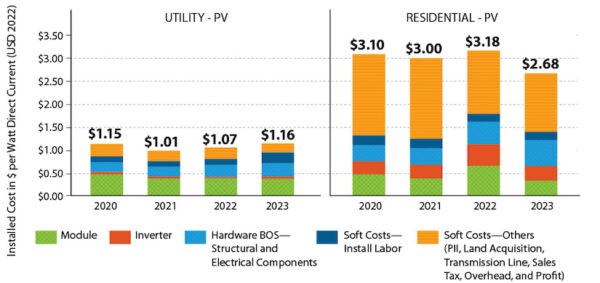
NREL anticipates rising utility-scale costs, and decreasing residential costs.
Learn more about equipment costs
The National Renewable Energy Laboratory has updated its annual cost modeling tool in light of the Inflation Reduction Act, revealing increased labor costs for utility-scale solar projects and predominantly lower hardware costs due to new manufacturing tax credits.
The U.S. Department of Energy’s National Renewable Energy Laboratory (NREL), in collaboration with the Solar Energy Technologies Office (SETO), recently released its U.S. Solar Photovoltaic System and Energy Storage Cost Benchmarks, With Minimum Sustainable Price Analysis: Q1 2023.
This year’s analysis indicates a contrasting trend: While utility-scale solar project costs are rising, residential project expenses are decreasing. An 8% increase in utility-scale costs is attributed to rising labor expenses, influenced by the Inflation Reduction Act’s (IRA) implementation of new prevailing wage requirements tied to a 30% tax credit. Conversely, residential solar benefitted from reduced prices in modules, inverters, logistics, and customer acquisition, resulting in a 16% overall decrease in residential costs despite rising financing expenses.
For 2023, NREL has refined its cost-modeling methodology by integrating feedback from industry stakeholders and updating its economic assessments to reflect the IRA’s impact on labor and hardware expenses. The analysis now also includes the effects of rising interest rates, which have become a more prominent cost factor than in prior years.
The report also reveals that while U.S. module prices decreased from 2022, module prices are still slightly higher than in 2021. Commodity market prices for copper and other metals have settled near their 2021 levels, reducing this year’s costs for racking and the electrical balance of the system. However, with the Consumer Price Index signaling a 15% inflation increase during the covered period, inflation remains a substantial factor in cost hikes.
The report expands its scope to include operations and maintenance (O&M) costs and community solar projects for the first time. Pricing data for commercial solar projects ranging from 500 kW to 2 MWdc was excluded to accommodate this. As in prior years, energy storage costs will be factored into all project sizes.
The findings show significant insurance expenses for residential solar projects and the management of community solar customers. Suggesting higher costs for third-party-owned assets, given that most homeowners typically do not need to increase their coverage. Additionally, long-term O&M costs for energy storage systems appear heavily influenced by the need to replace battery cells.
This year’s NREL report introduces refined cost benchmarks, reflecting a more nuanced solar and energy storage market analysis. Emphasizing the influence of the IRA, the updated benchmarks incorporate fresh industry data to portray labor and hardware costs accurately. The benchmarks also account for the financial implications of rising interest rates for the first time, underscoring their growing impact on the solar industry’s economics.
The methodology revision includes a shift from commercial to community solar project analysis, aligning more closely with current market trends. Despite these changes, the core premise of the Q1 Benchmark remains A ground-up approach modeling the best-case scenario for pricing. For a practical, “real world” perspective on pricing, the report directs readers to the Lawrence Berkeley National Laboratory’s Tracking the Sun report.
A key insight from the NREL benchmarks is the distinction between the “modeled market price” (MMP) and the “minimum sustainable price” (MSP). The MSP aims to identify the lowest prices that ensure suppliers’ financial viability over the long term, based on input costs that similarly allow for their suppliers’ sustained solvency.
Despite the savings from lower residential hardware prices, the increased cost of borrowing has partially offset these advantages, resulting in a 15% increase in the financial aspect of residential solar pricing, with community solar and utility-scale solar up 18% and 19%.
An intriguing aspect, though potentially elusive for the average buyer, is the report’s inclusion of possible cost savings attributable to the IRA’s 45X manufacturing tax credits, which suggest lower hardware prices. The modeled discounts are as follows:
$0.07/Wdc for PV modules
$0.11/Wac for microinverters
$10/kWh for battery modules
$0.87/kg for torque tubes
$2.28/kg for structural fasteners of a tracking system
The report highlights that without the 45X credit applied to domestically assembled modules and inverters, the cost for a residential PV system would stand at $2.90/Wdc. However, with the IRA’s benefits fully realized, this cost will decrease to $2.68/Wdc.
Moreover, some industry experts suggest that the IRA’s framework may have positioned the United States to become an exporter of solar modules.
Reprinted from research via NREL by Robert W. Benedict III

RE+/SPI 2023
Please contact us at Unicorn Solar at 916-284-8841

Please contact Karlita.benedict@unicorn-sd.com,Denise@unicorn-sd.com or robert.benedict@unicorn-sd.com